
Explore Tableau Blueprint: Proficiency
Educate users, measure impact, and establish best practices
Maximizing analytics investments and capitalizing on the transformative potential of data means that everyone encountering it—regardless of skill levels and data fluency—must be able to turn data into insights effectively. Beyond data capabilities, this also means employees actively seek using data over decision-making by instincts or feelings. The Proficiency workstream is focused on user education, measuring adoption and engagement, and increasing data fluency within your organization through best practices.
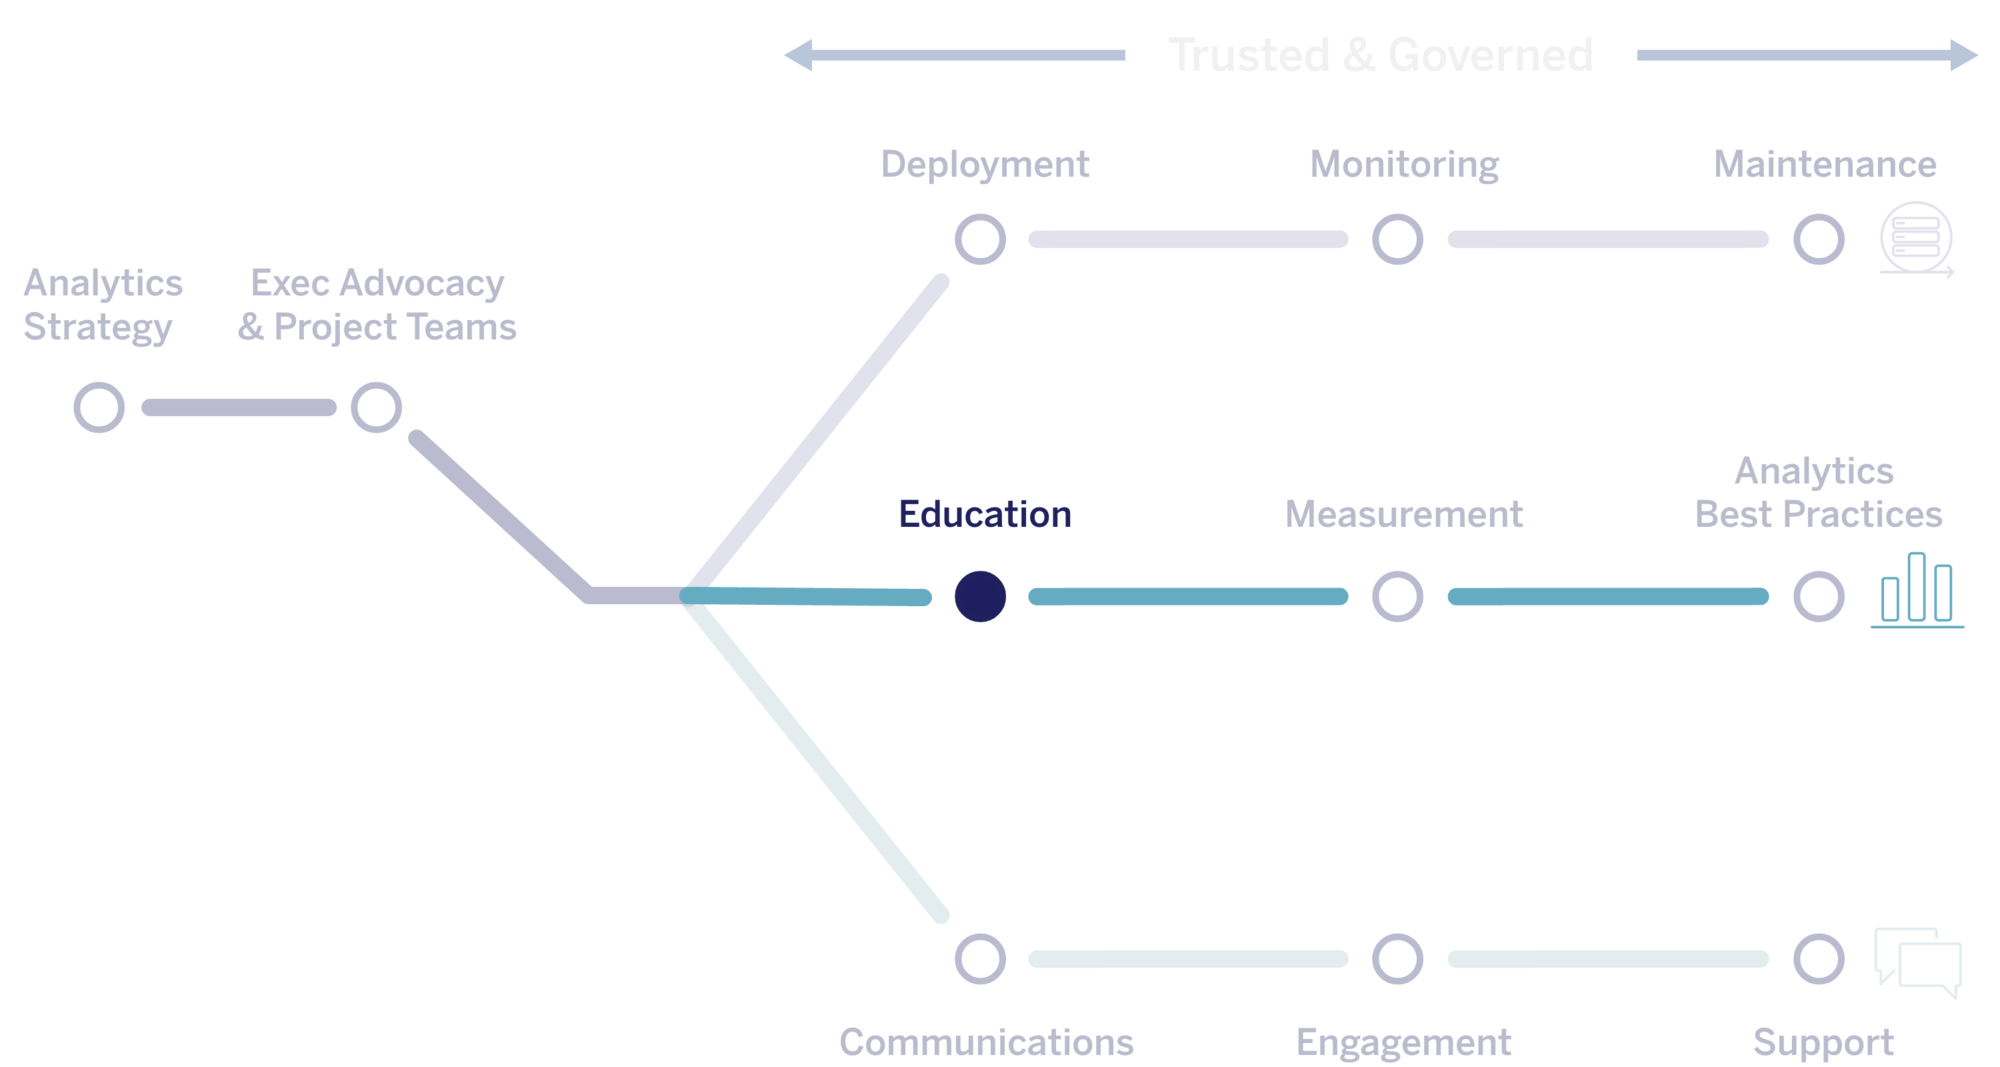
Education
You’ll build scalable and ongoing learning plans for your users by evaluating their relationship to data and fitting training to their needs and learning styles. In addition to Tableau-specific skills, users will need to understand your company-specific processes for working with data. You should also develop accountability systems to validate and celebrate their knowledge—like certifications.
This topic covers:
- Skills by Tableau education role
- Skills by Tableau license type
- Developing a Tableau education plan
- Accountability and reward systems

Measurement
You’ll measure user engagement and adoption to help ensure the content being created and consumed is discoverable, fresh, and relevant. Understanding the relationship between data sources and workbook content, users, and server performance, scalability, and sizing is a reliable way to look into current usage and plan for future growth.
This topic covers:
- Tableau administrative roles and responsibilities
- Tableau administrative views
- Tableau Server content utilization
- Tableau user engagement
- Content size and performance
- Compliance
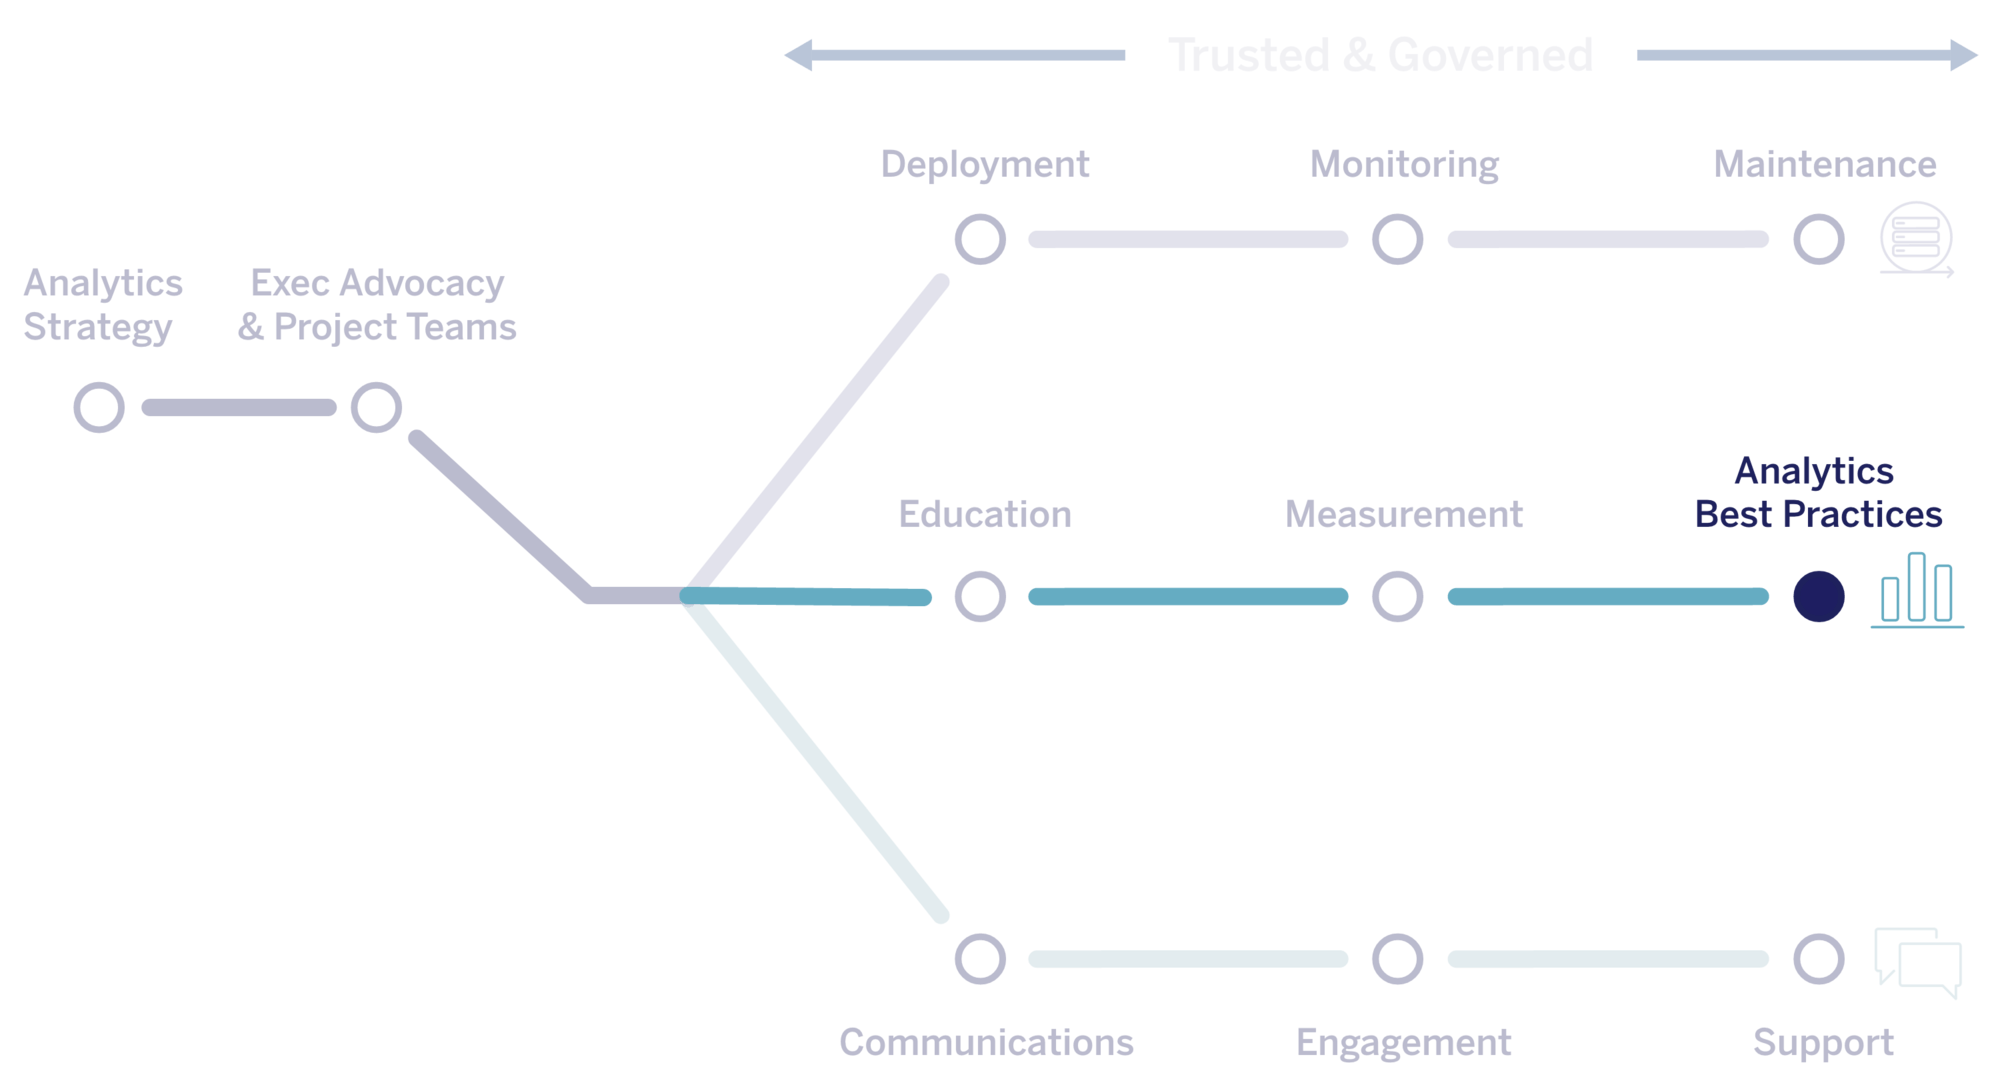
Analytics Best Practices
You’ll enable your users with documented guidelines, standards, and processes for the discovery, interpretation, and presentation of data. In developing and making these enablement resources available, you’ll introduce, reinforce, and institutionalize best practices that drive behavioral change and informed decision-making.
This topic covers:
- Why visual analytics?
- The cycle of visual analysis
- Visual best practices
- Organizational assets
"Tableau helped position Allstate Special Investigation Unit as an industry leader. Before it was always numbers in rows and columns. Now it's so much easier to actually see the trends, the story, and the power the data brings. Tableau has unleashed a creativity in me as an individual, and with that problem solving, it has unleashed the power of data."
"Tableau is seen as a business change program, to change the culture and way of thinking about data and decision-making. As we worked through our journey and showed people how easy it was to get insights themselves, the real eureka moments came out. Now we can take a step back and support them in their own journeys rather than having to do everything centrally."
Continue exploring Tableau Blueprint
discover the tableau blueprint methodology
build your analytics vision
define a governance model


Are you building proficiency?
ACCESS THE TABLEAU BLUEPRINT ASSESSMENTGet Started with Tableau Blueprint