Interactive Mathematical Analytics
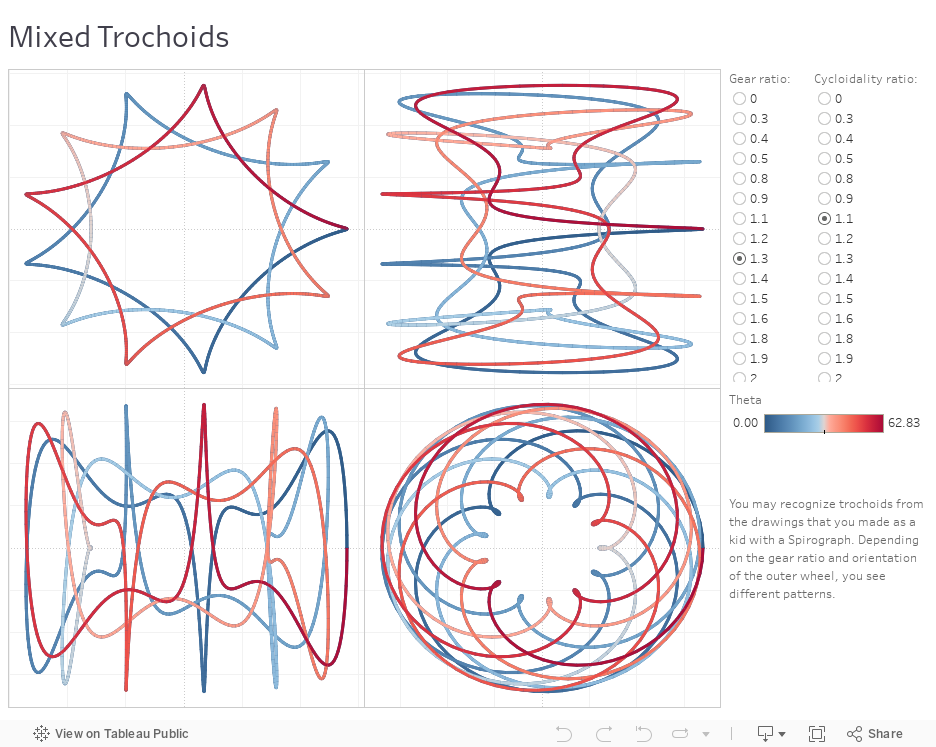
This workbook illustrates the family of curves called trochoids. To get a trochoid, fix a point on a circular disk (like a reflector in a bicycle wheel) and roll it along another circle. Using filters, dashboards, and drag-and-drop exploration, we can generate a variety of interesting curves with our back-end functionality. Tableau gives you the flexibility to visualize virtually any type of data.